WQ-INFO is a series of experiments in data visualization
Began in September 2022 with support from Windlas Biotech Ltd, and continued on from December 2023 - March 2025 with support from the IBM Sustainability Accelerator program.
The project is currently closed.
When looking at our fieldwork data from 2017 - 2020 (WQ-MAPS), we are able to identify pollution hotspots by plotting the same on a map. However, we are not able to understand the cause(s) of said pollution because there is missing contextual data (eg: location of sewage treatment plants (STPs), industries, drainage network carrying domestic waste, etc). In March 2023 & March 2024, we added contextual data to our visualisations of fieldwork: https://server.nikhilvj.co.in/w2c/w2c-frontend/ for one location in Uttarakhand.
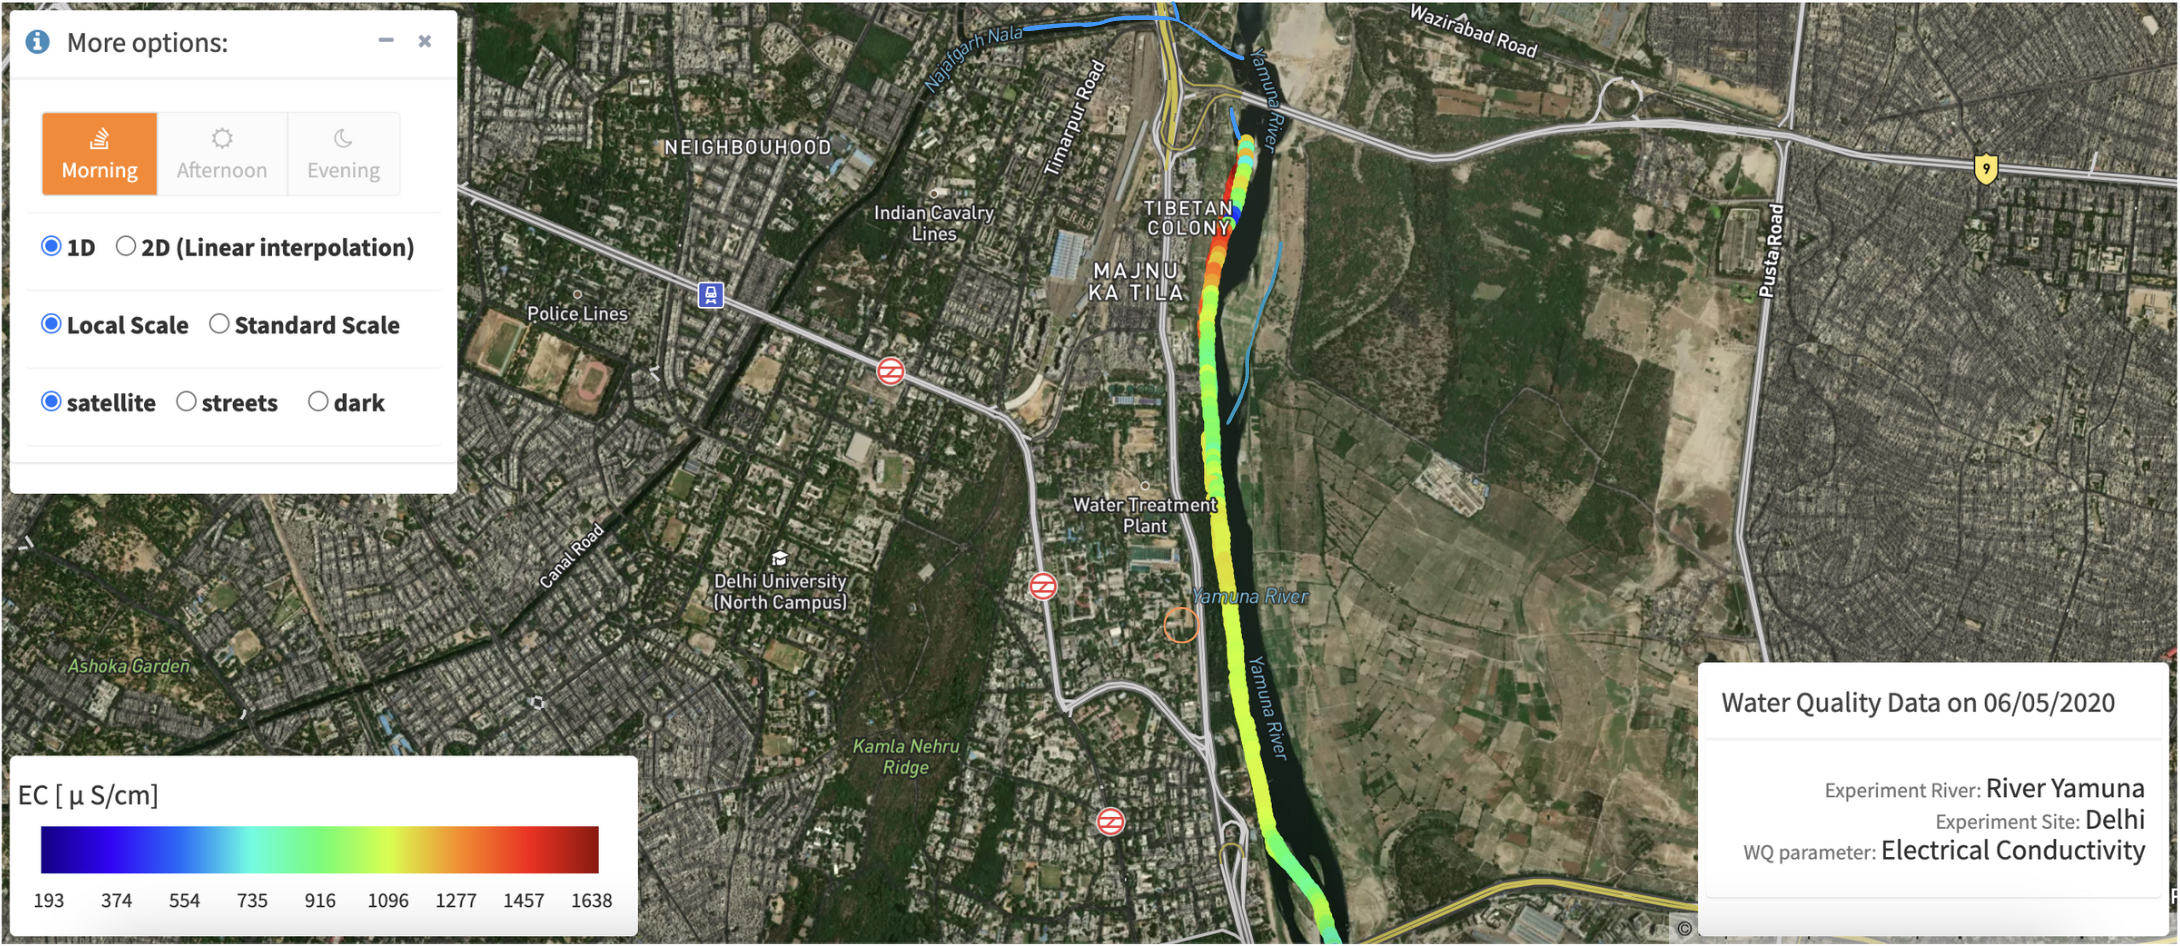
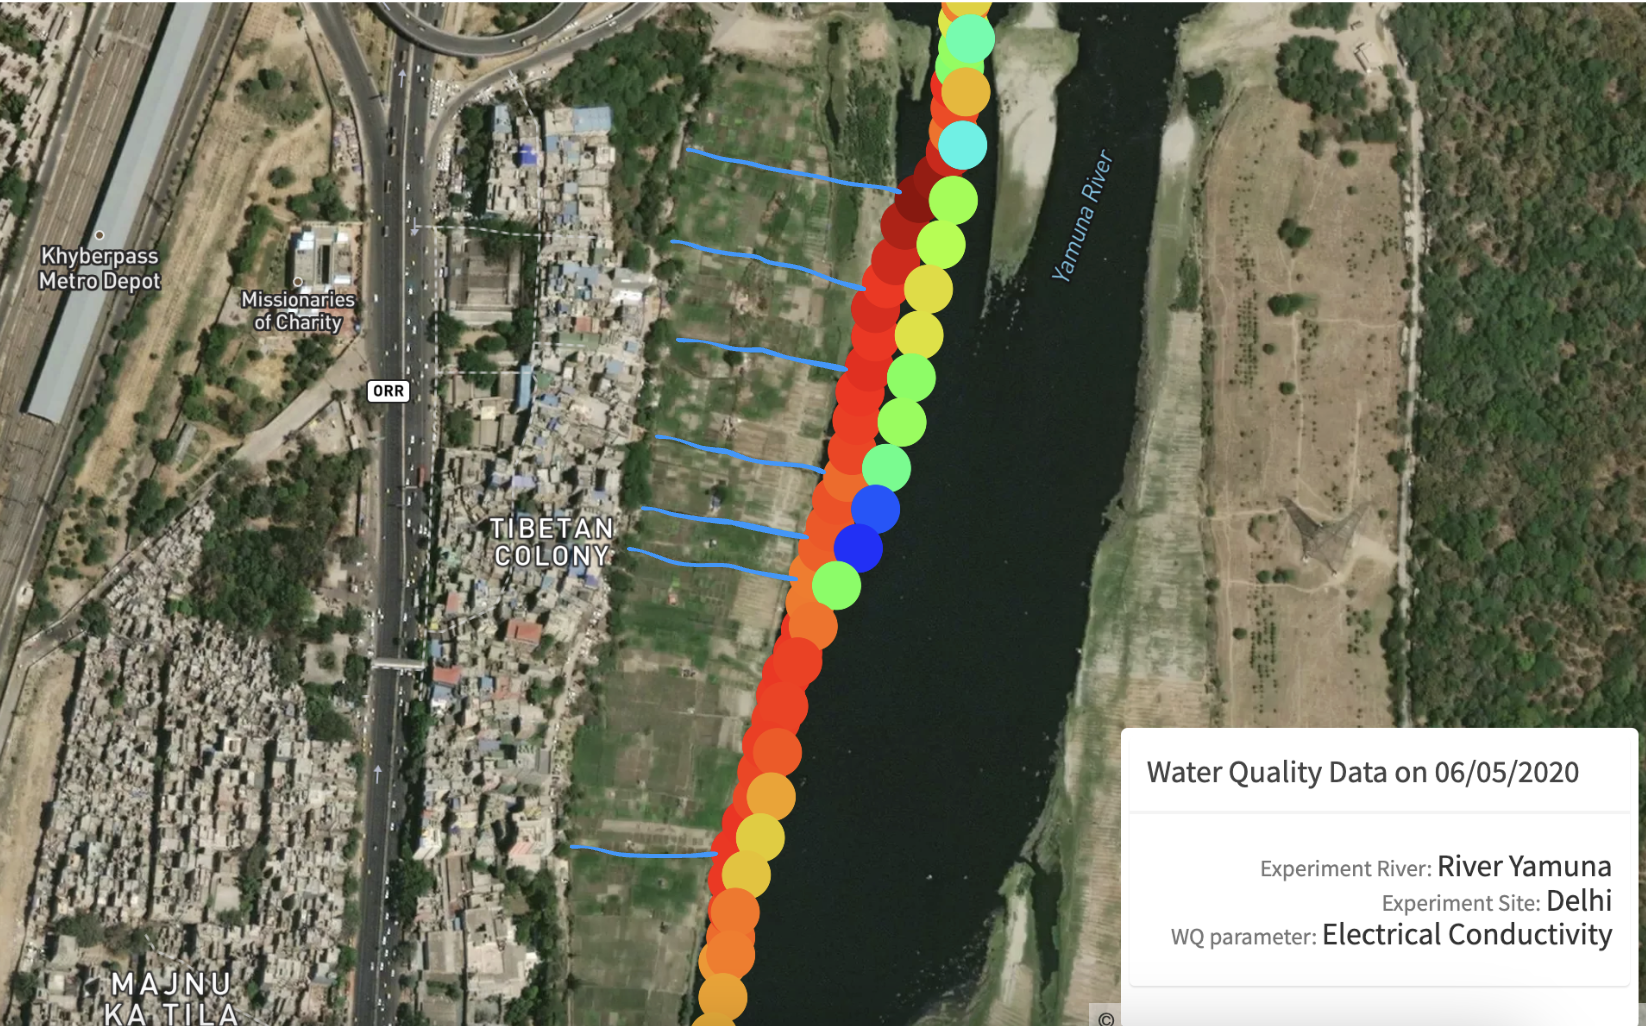
These two images are screenshots from our website Thoreau, showing Electrical Conductivity (EC) measures along the west bank of River Yamuna. We see a spike in EC values near 'Tibetan Colony'. To understand the cause of the spike, we manually mapped the informal drains which we found to be carrying domestic waste from Tibetan Colony into the river during our fieldwork. These drains have been annotated in blue in the images.
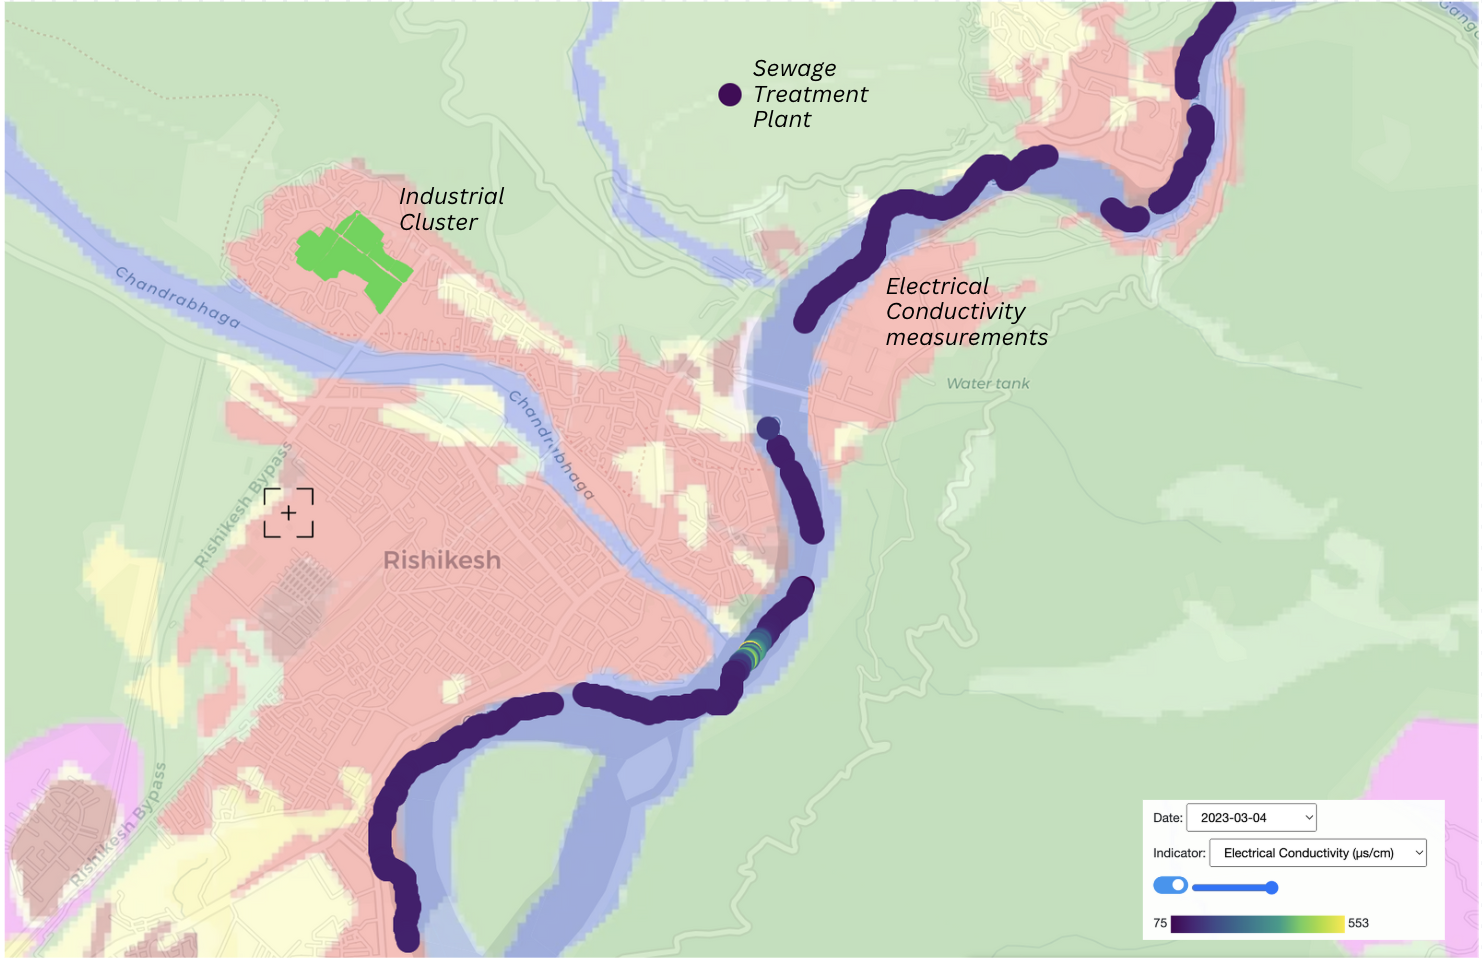
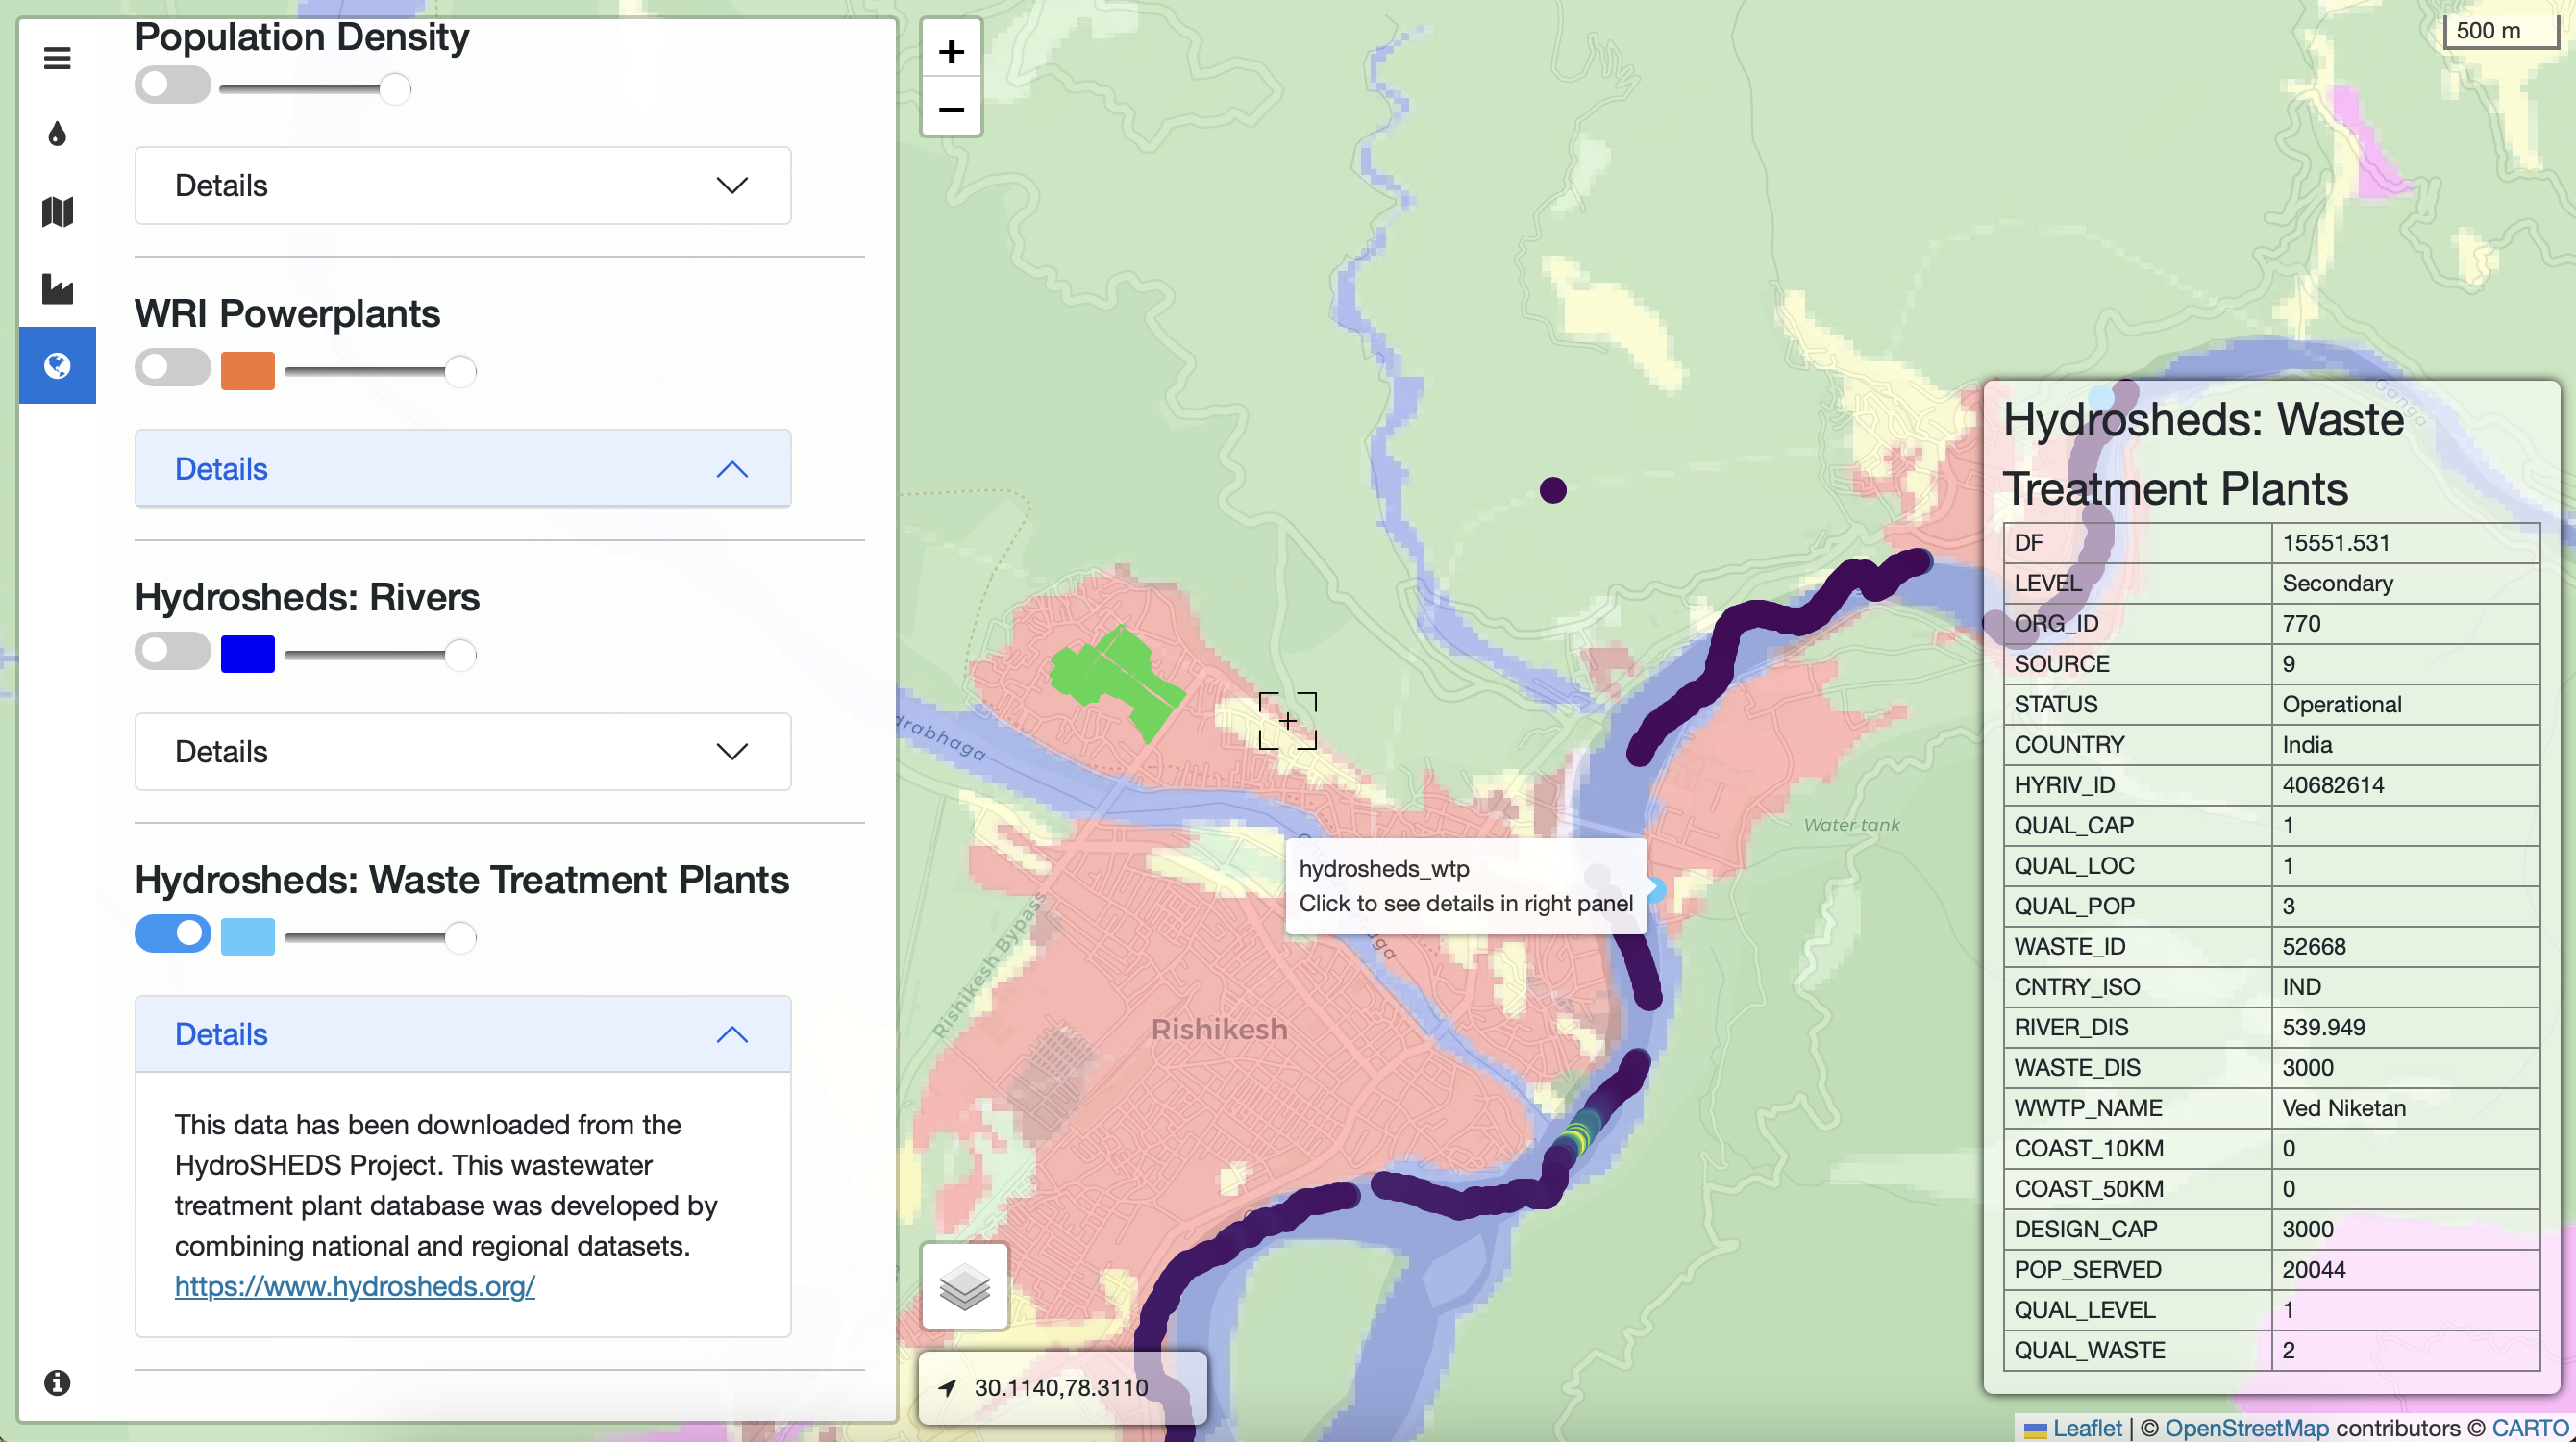
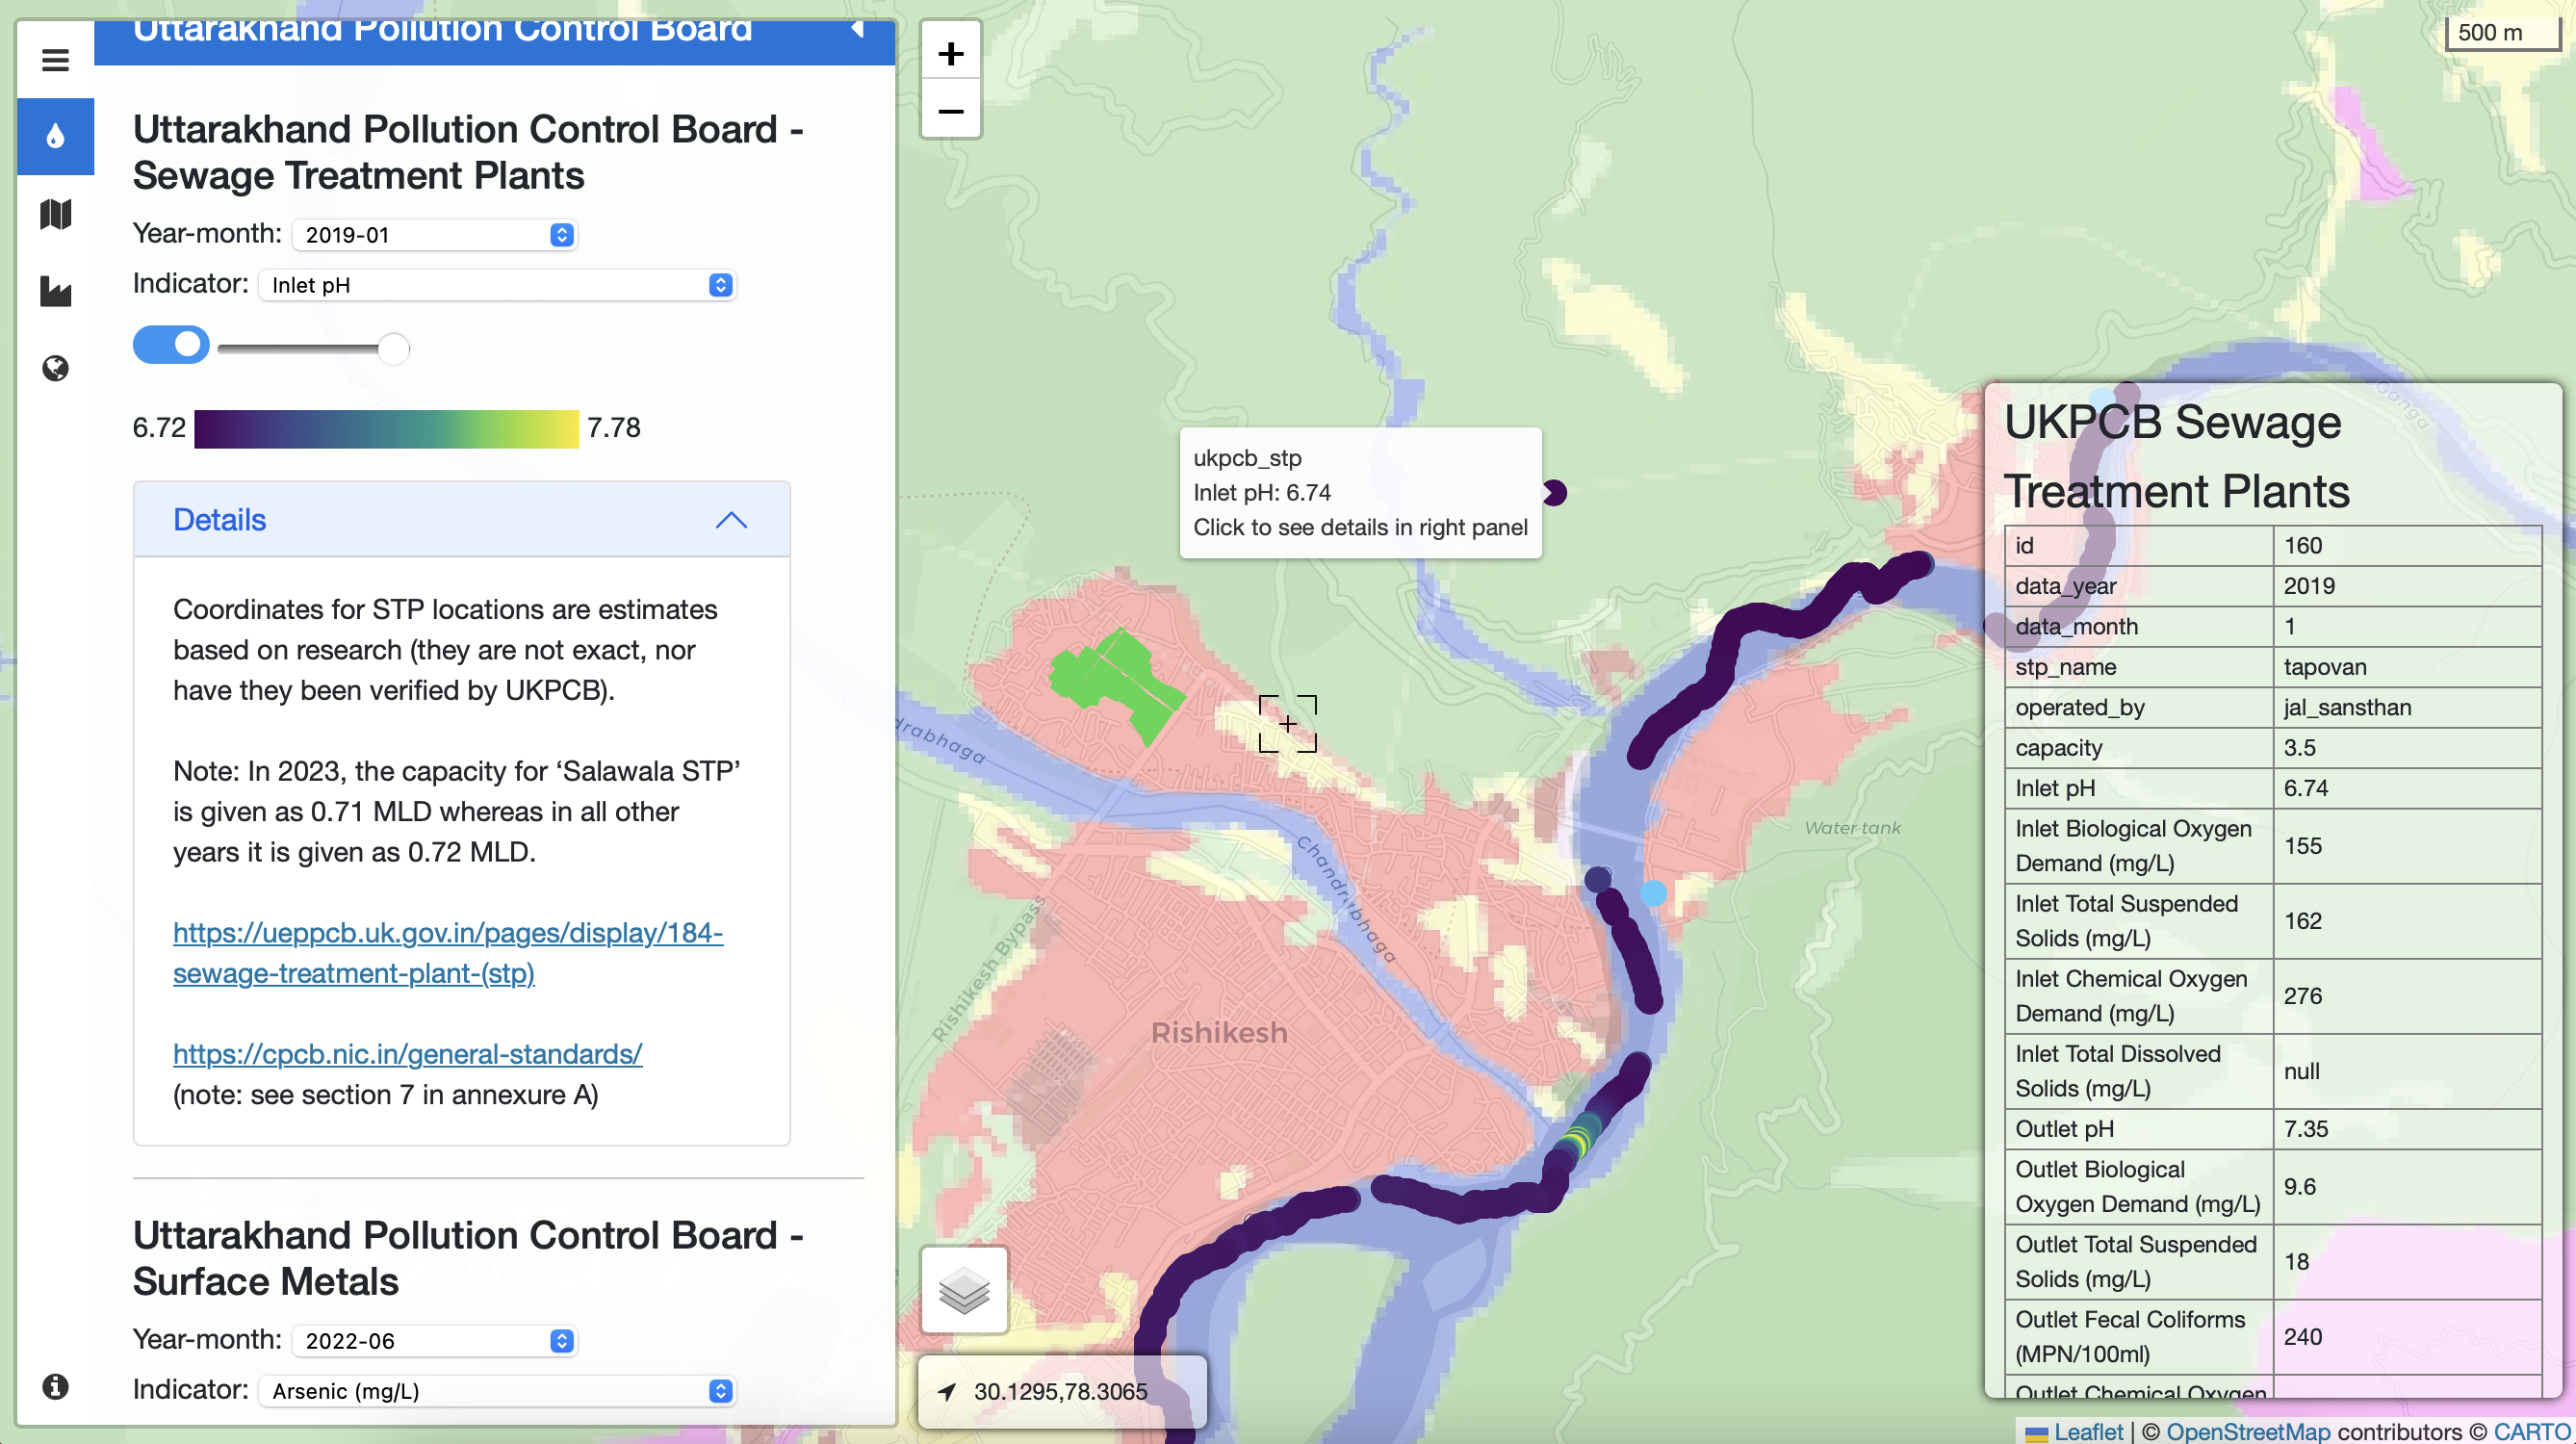
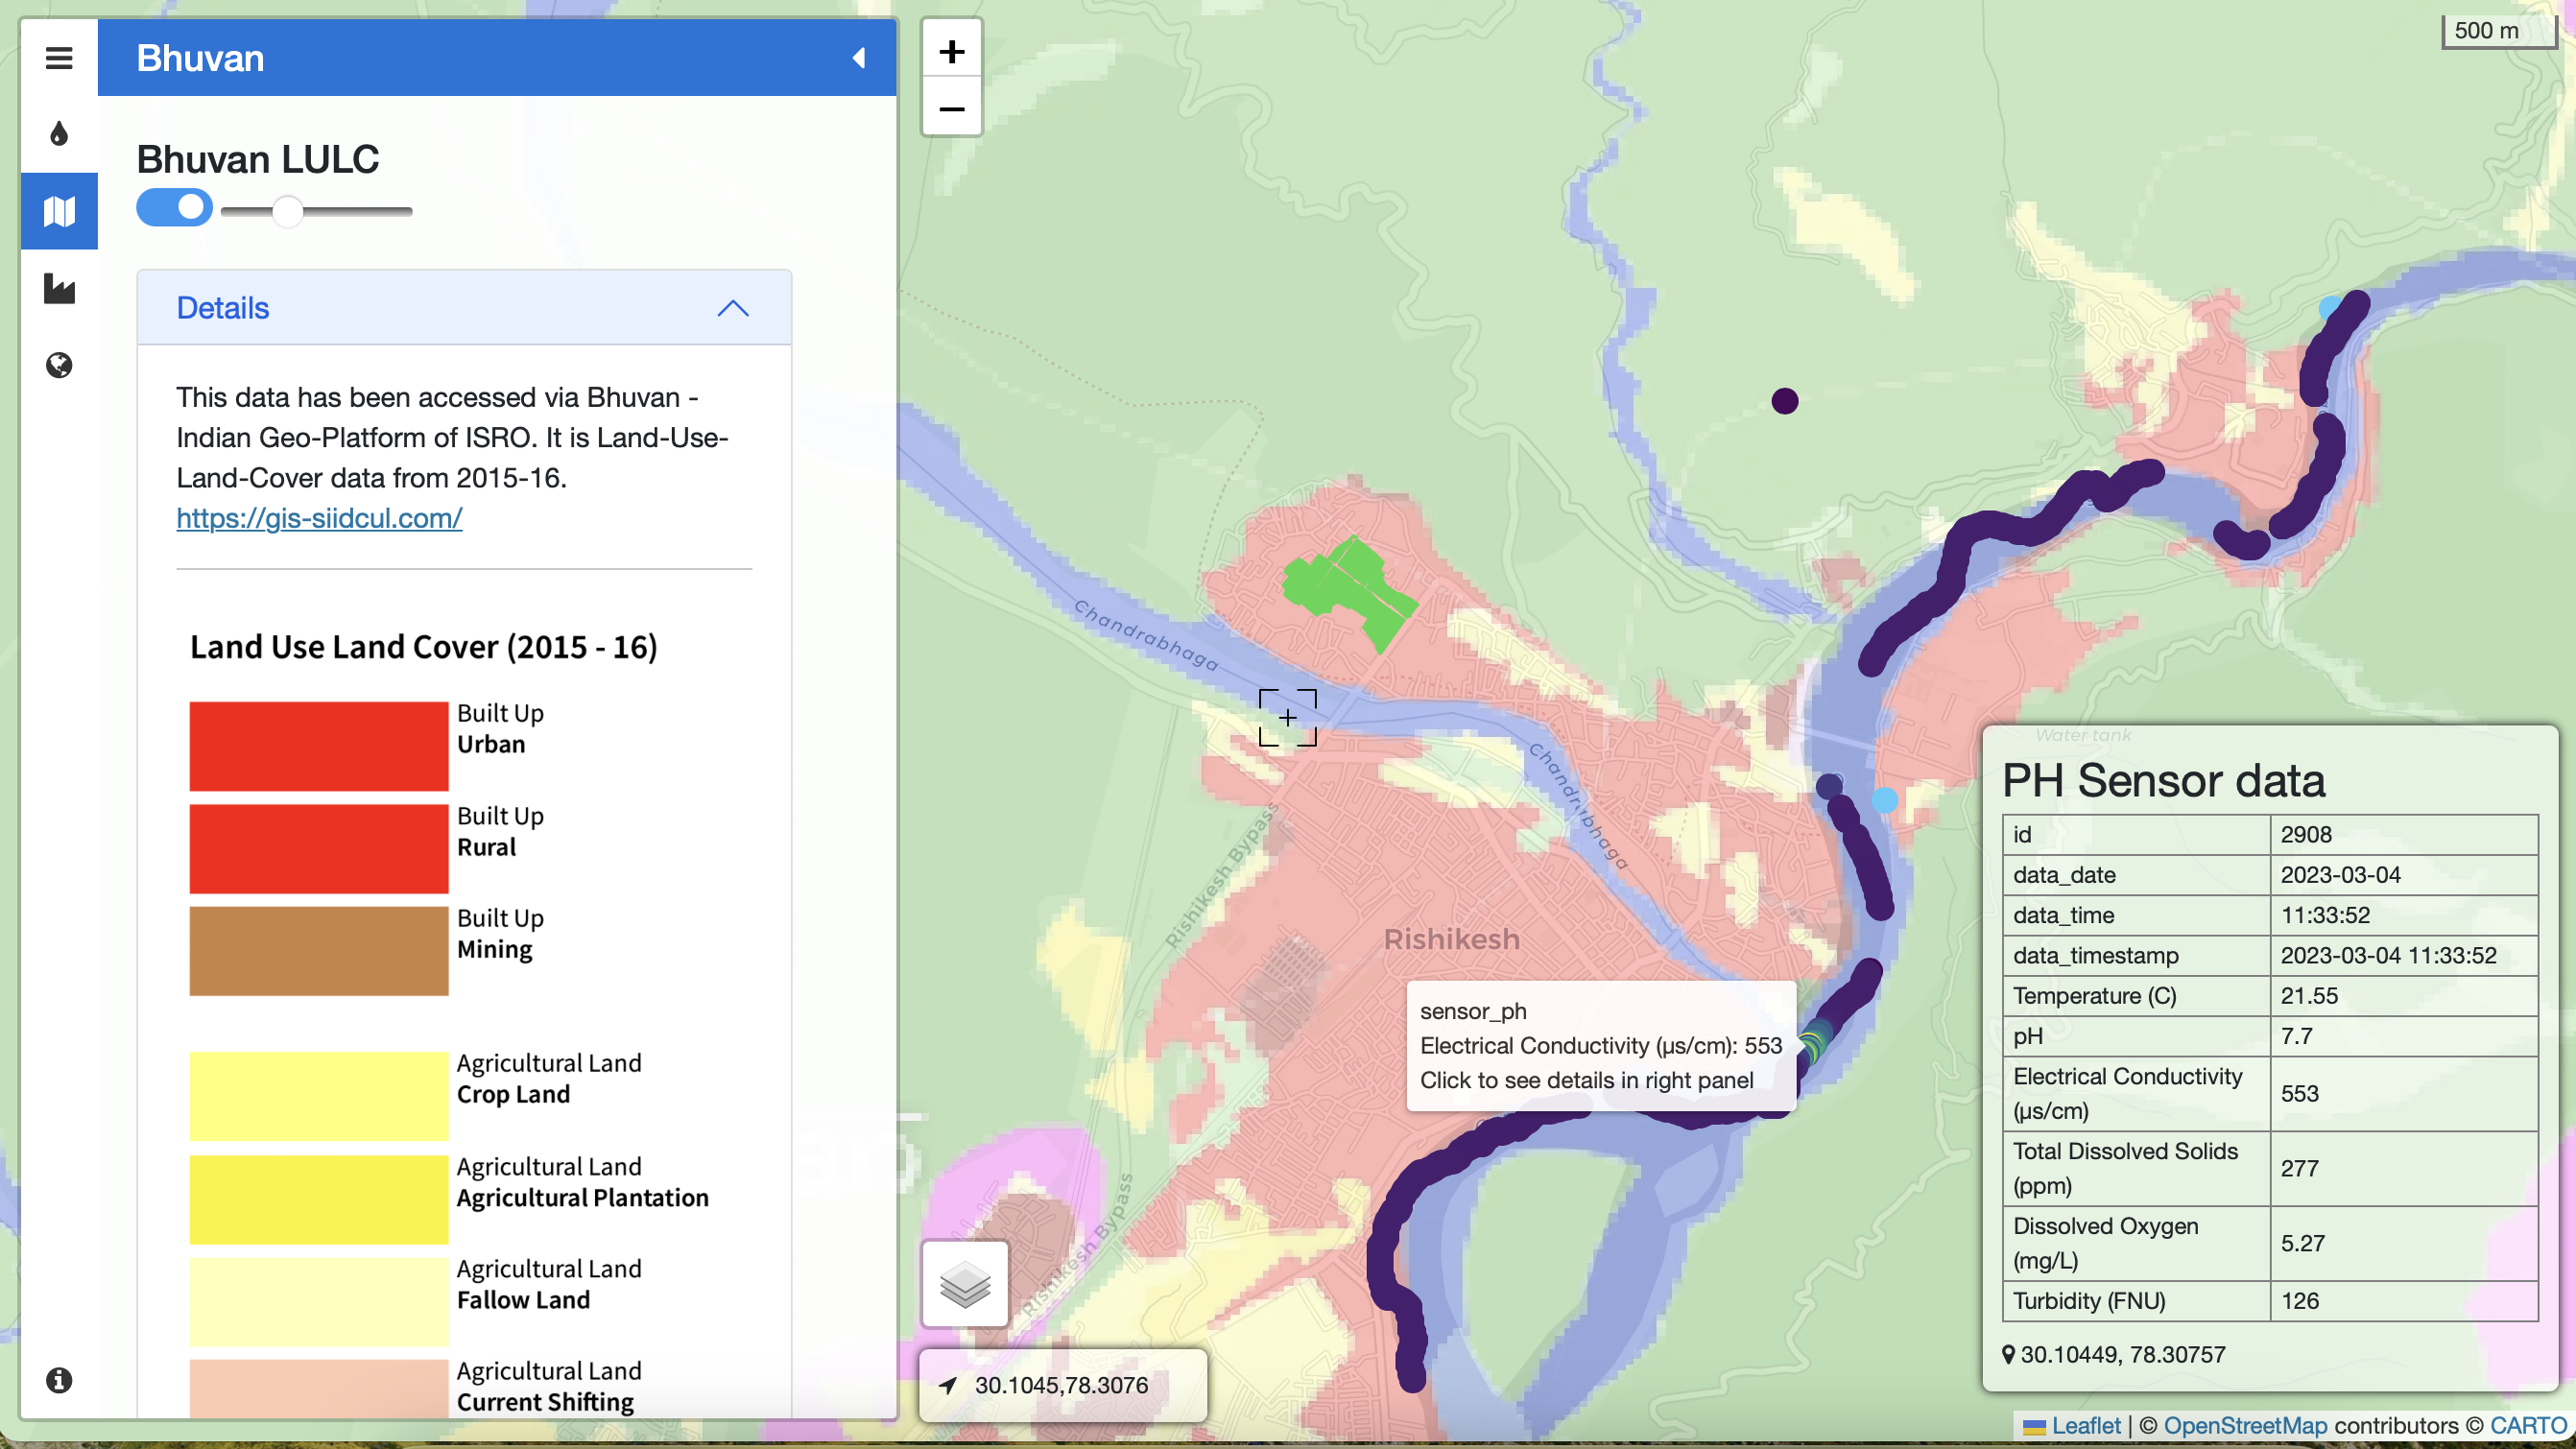
This series of images is taken from the visualization developed post our fieldwork in March 2023. It maps Electrical Conductivity (EC) measurements from W2C fieldwork in Rishikesh, Uttarakhand layered with contextual information including the land use land cover (Bhuvan), industrial clusters (SIIDCUL), and sewage treatment plants (Uttarakhand Pollution Control Board). Here, we observe a spike in EC values at the confluence of the drain 'Chandrabhaga' and River Ganga.
IBM Sustainability Accelerator
December 2023 - March 2025Our participation in the IBM Sustainability Accelerator program from December 2023 - March 2025 focused on developing a PDF to geoJSON pipeline. Necessary contextual information to understand causes of water pollution include locations of industries, mines, sewage / common effluent / wastewater treatment plants, land-use-land-cover). This information is fragmented across multiple government portals such as (India WRIS, Parivesh, etc). Much of this information is available in PDF format. Spatial information (latitude / longitude) is available at times and other times only available as a detailed address (without coordinates)
- 1. Mine location information: latitude-longitude coordinates and the available text address
- 2. Other critical information about the mine, including type of project, area / depth of project, type of extraction / generation, effluent discharge, water quality and air quality monitoring
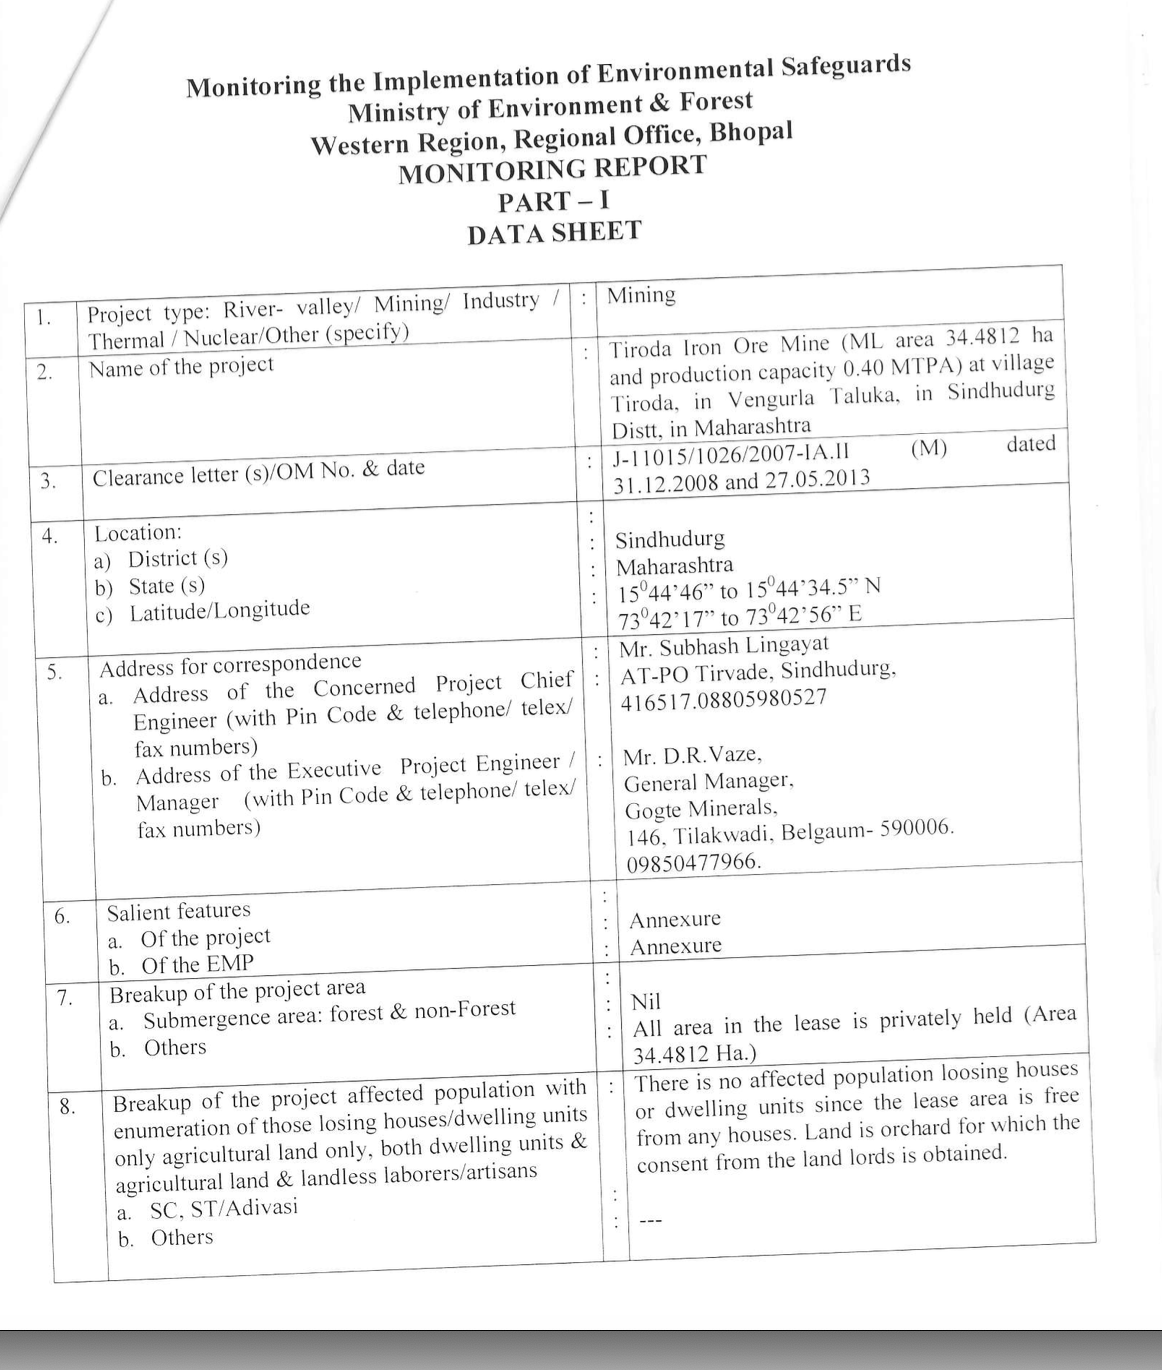
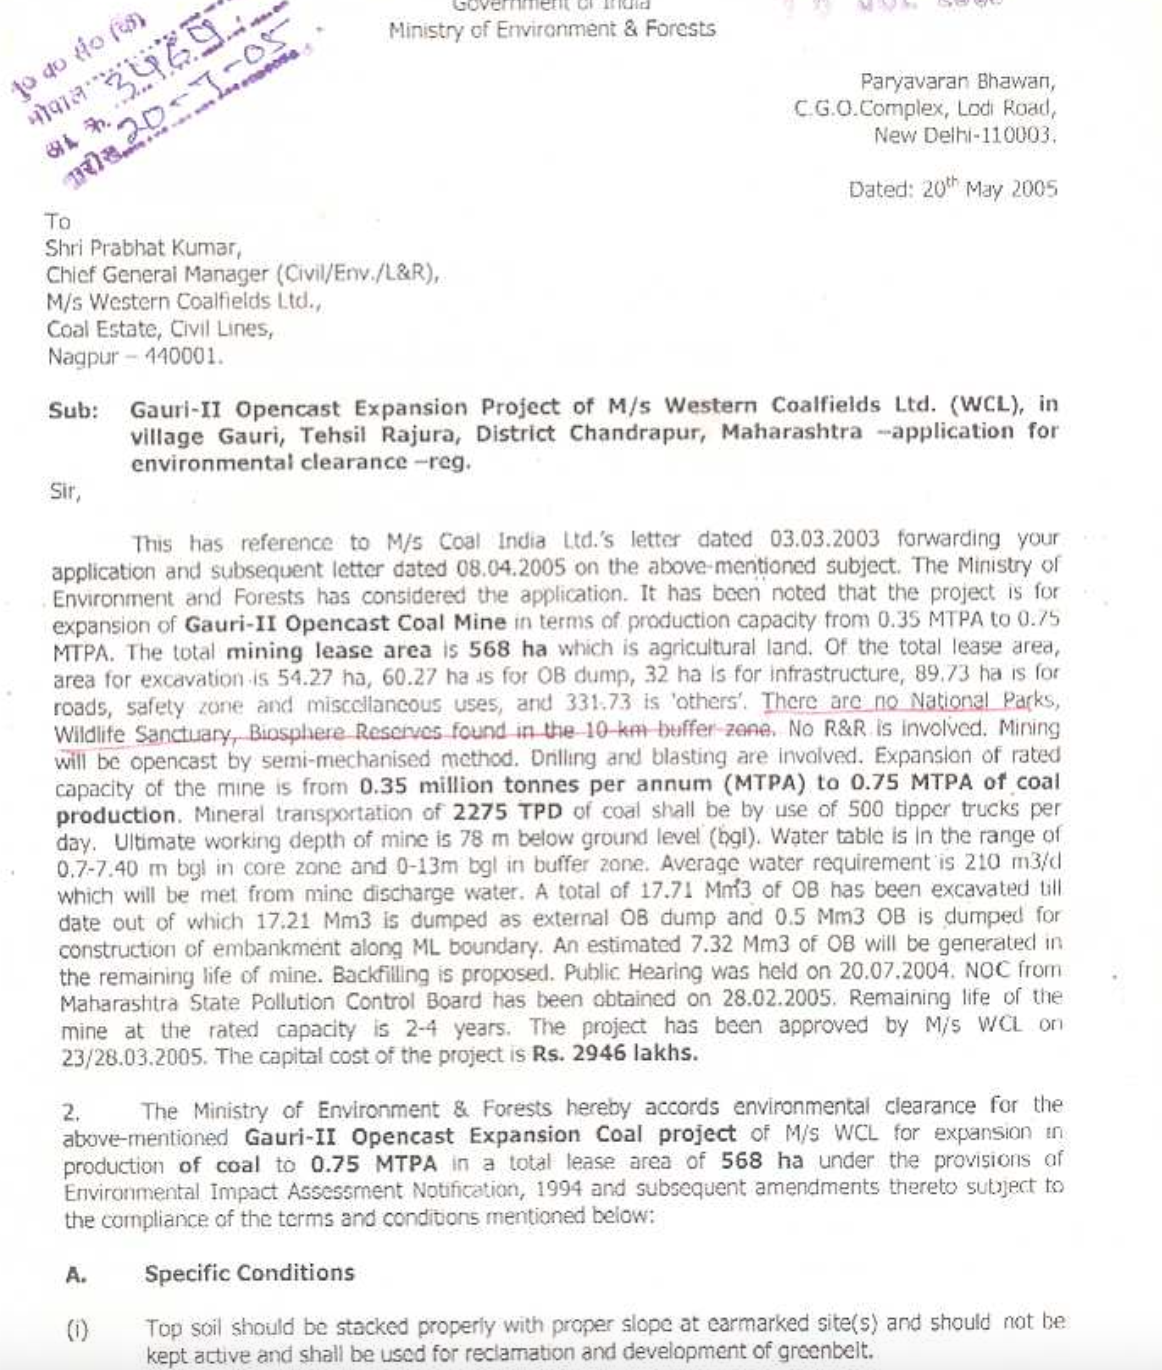
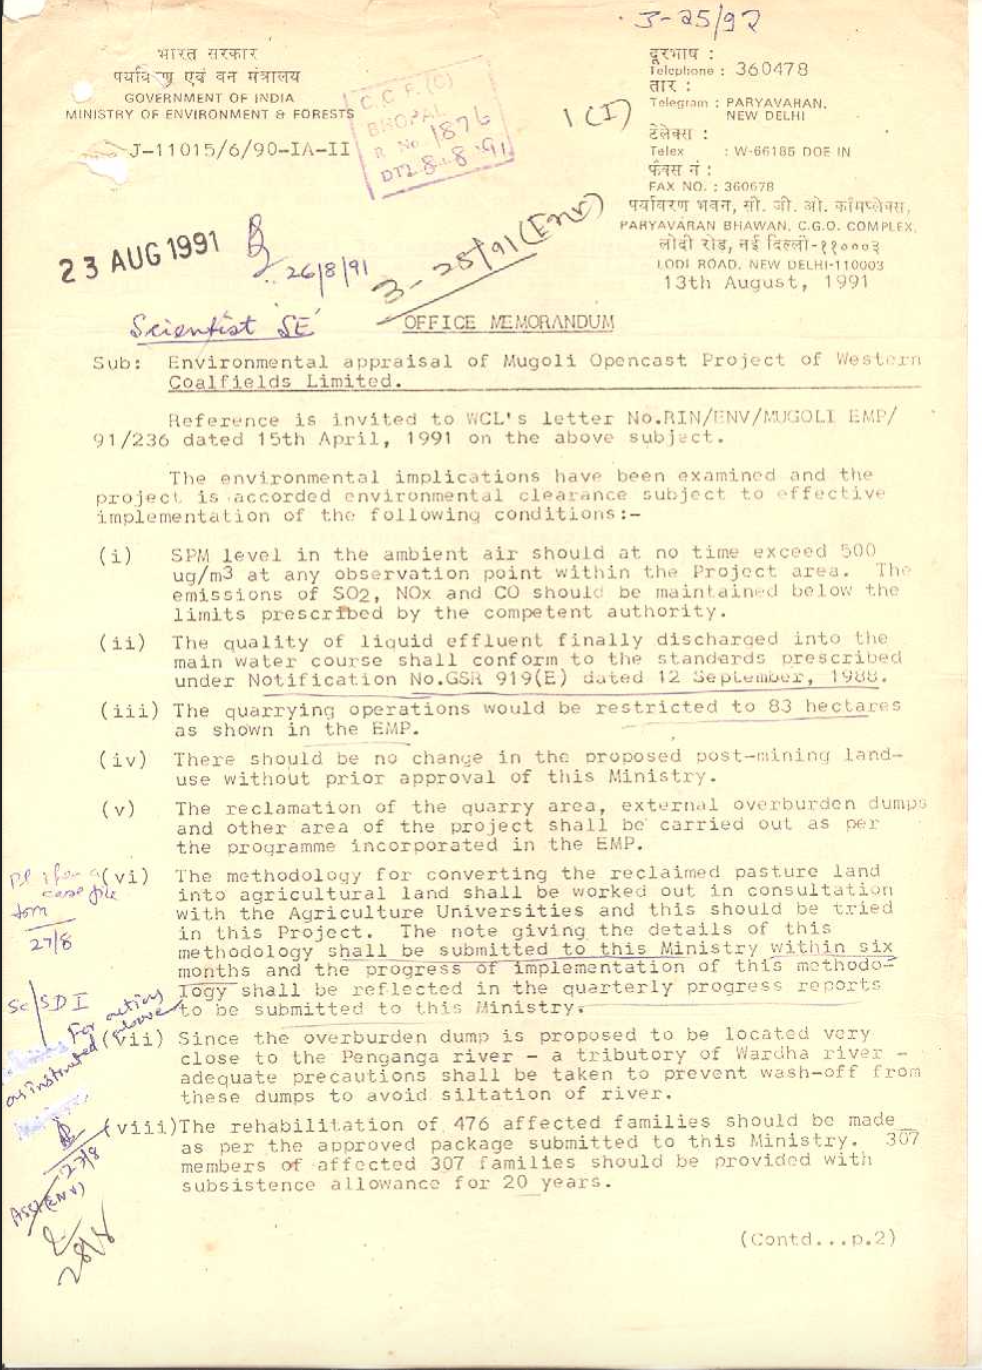
We limited our scope to Maharashtra. These documents were chosen to build our MVP using scanned documents from the 1990s - present day & for a range of spatial information (eg: some have coordinates, some don't). There are multiple documents to be associated with one mine (letters, monitoring reports etc). The MoEFCC mining reports are often published in formats that are neither machine readable nor consistent. That is, several documents (as shown in exhibit 03) are uploaded as scanned images. Existing OCR technology isn't always able to extract information from such documents. Moreover, the location information is at times published as latitude-longitude coordinates (exhibit 01), but other times only as a text address (exhibit 02)
Our aim with selecting these reports was to fine-tune a model to solve the above challenges, thereby developing a pipeline of PDF → Geojson file for any PDF with location information.
IBM's technical team fine-tuned LLaMA-3-70B-instruct, a 70-billion parameter large language model to convert unstructured mining property documentation into standardized GeoJSON formats. The model was hosted on IBM's WatsonX.ai platform and integrated into a serverless architecture.
Our processing pipeline consists of three primary stages, each designed to address specific challenges in water quality data extraction:
- 1. Document Processing Pipeline
- a. Raw document ingestion
- b. OCR processing and text extraction
- c. Clean document generation
- 2. Embedding Generation
- a. Vector embeddings creation using DeepSearch
- b. Storage in PostgreSQL (with pgvector)
- c. Document indexing for retrieval
- 3. Structured Data Generation
- a. GeoJSON conversion using fine-tuned LLaMA
- b. Validation and error handling
- c. MongoDB storage of processed results
The system handles both PDF documents and spreadsheets through parallel processing paths, with robust error handling via Dead Letter Queues (DLQ) and continuous monitoring through heartbeat APIs.
Alongside the development of WQ-INFO, we started playing around with Anthropic's generalised LLM claude.ai to test how well it could extract location information from MoEFCC's mining documents. Below are some of our notes, challenges, and findings from the testing
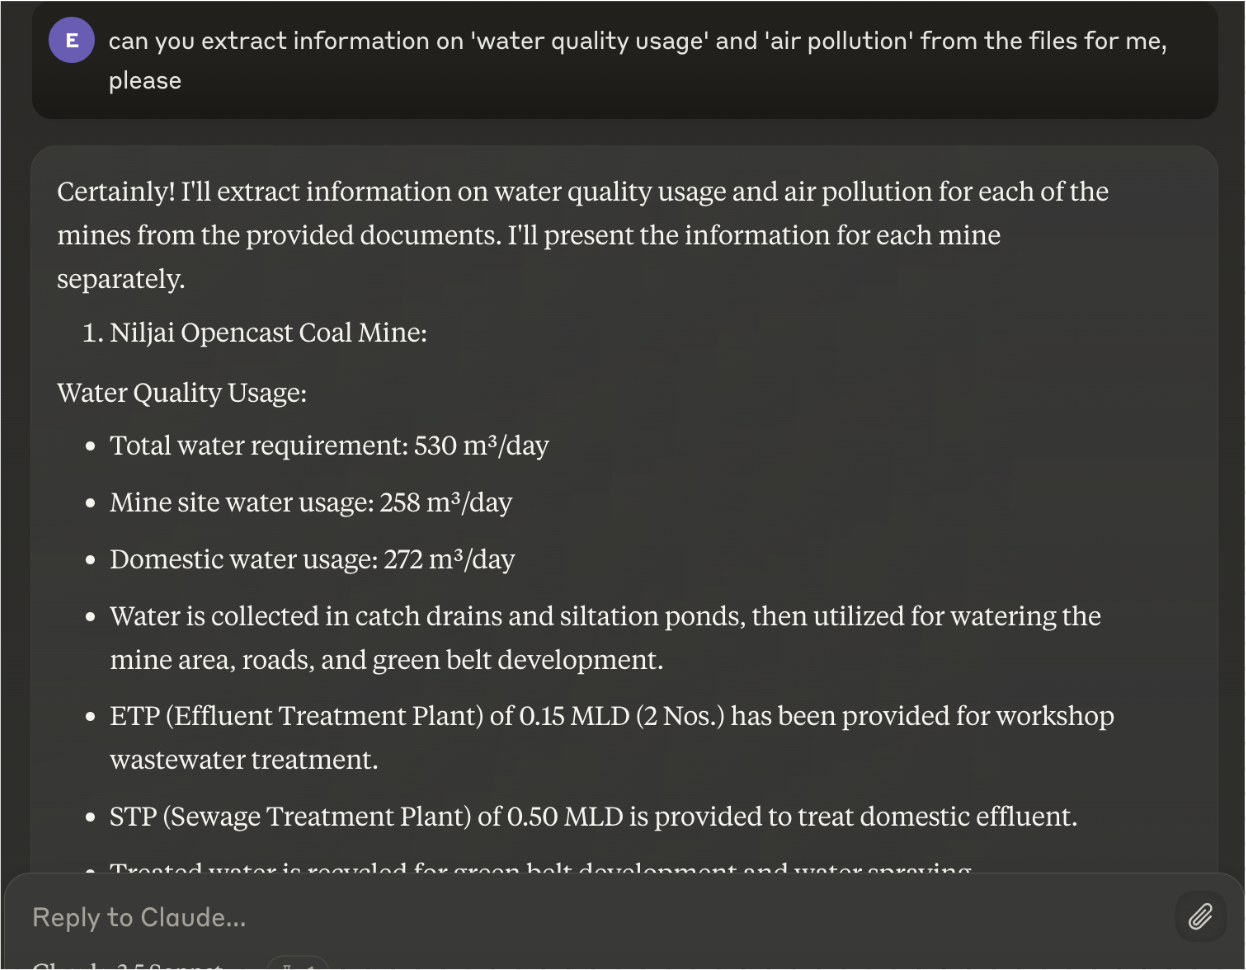
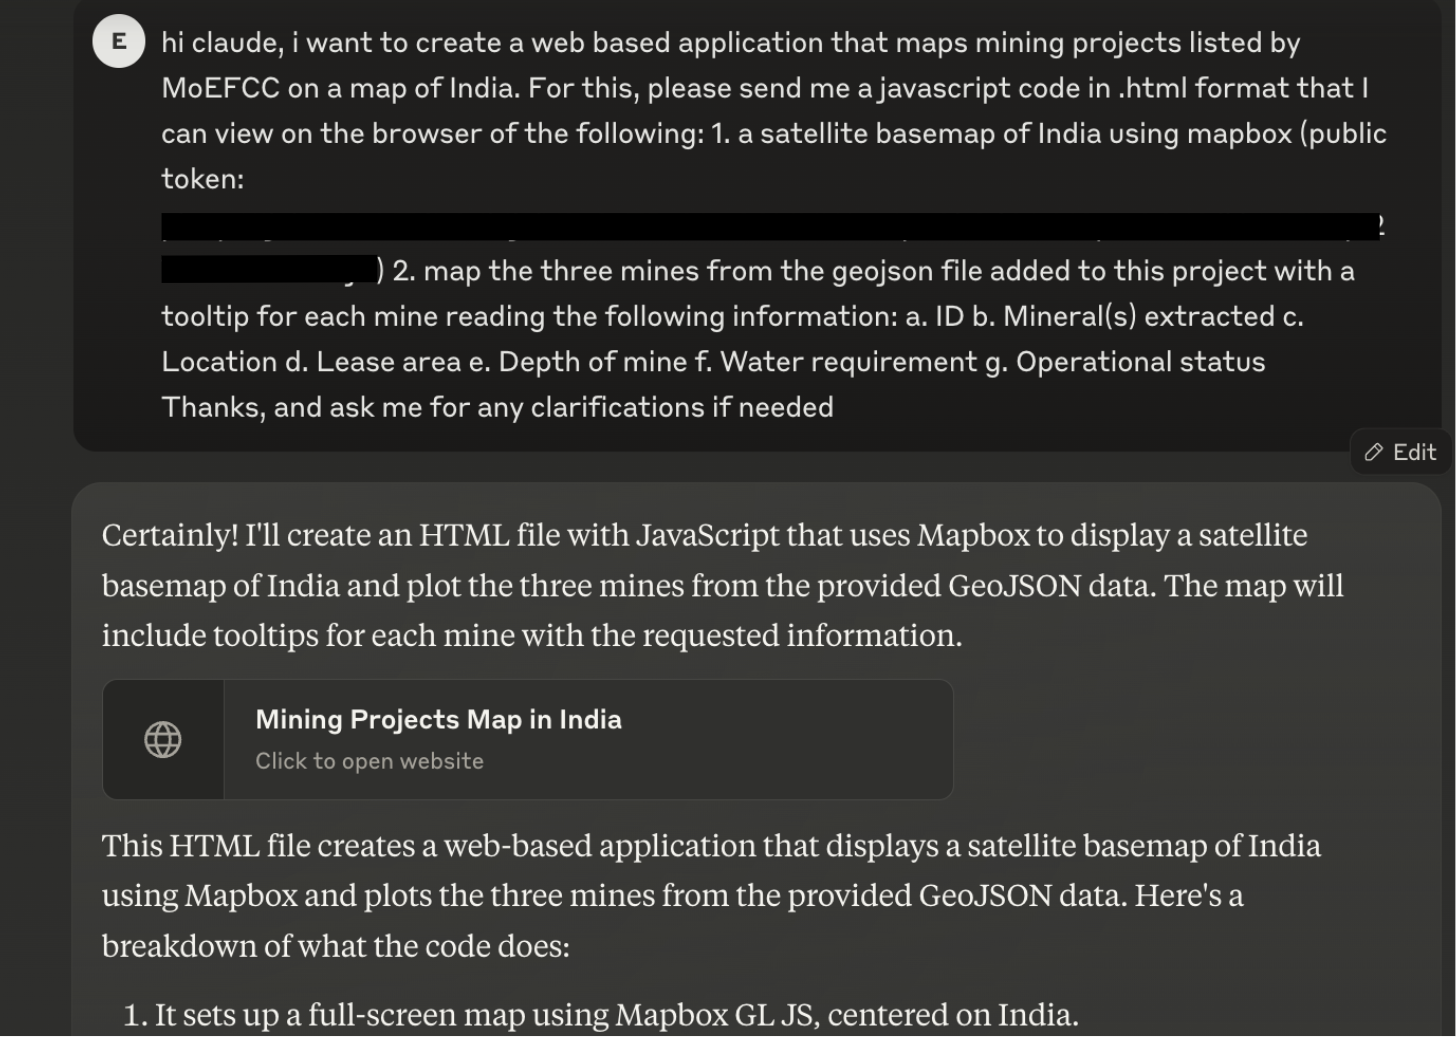
We uploaded MoEFCC mining documents onto claude.ai and prompted it to extract 'location information', 'water pollution information', and 'pollution information' from the PDF documents. Giving it a public key from mapbox, we asked it to return an html code plotting the mines on a map of India

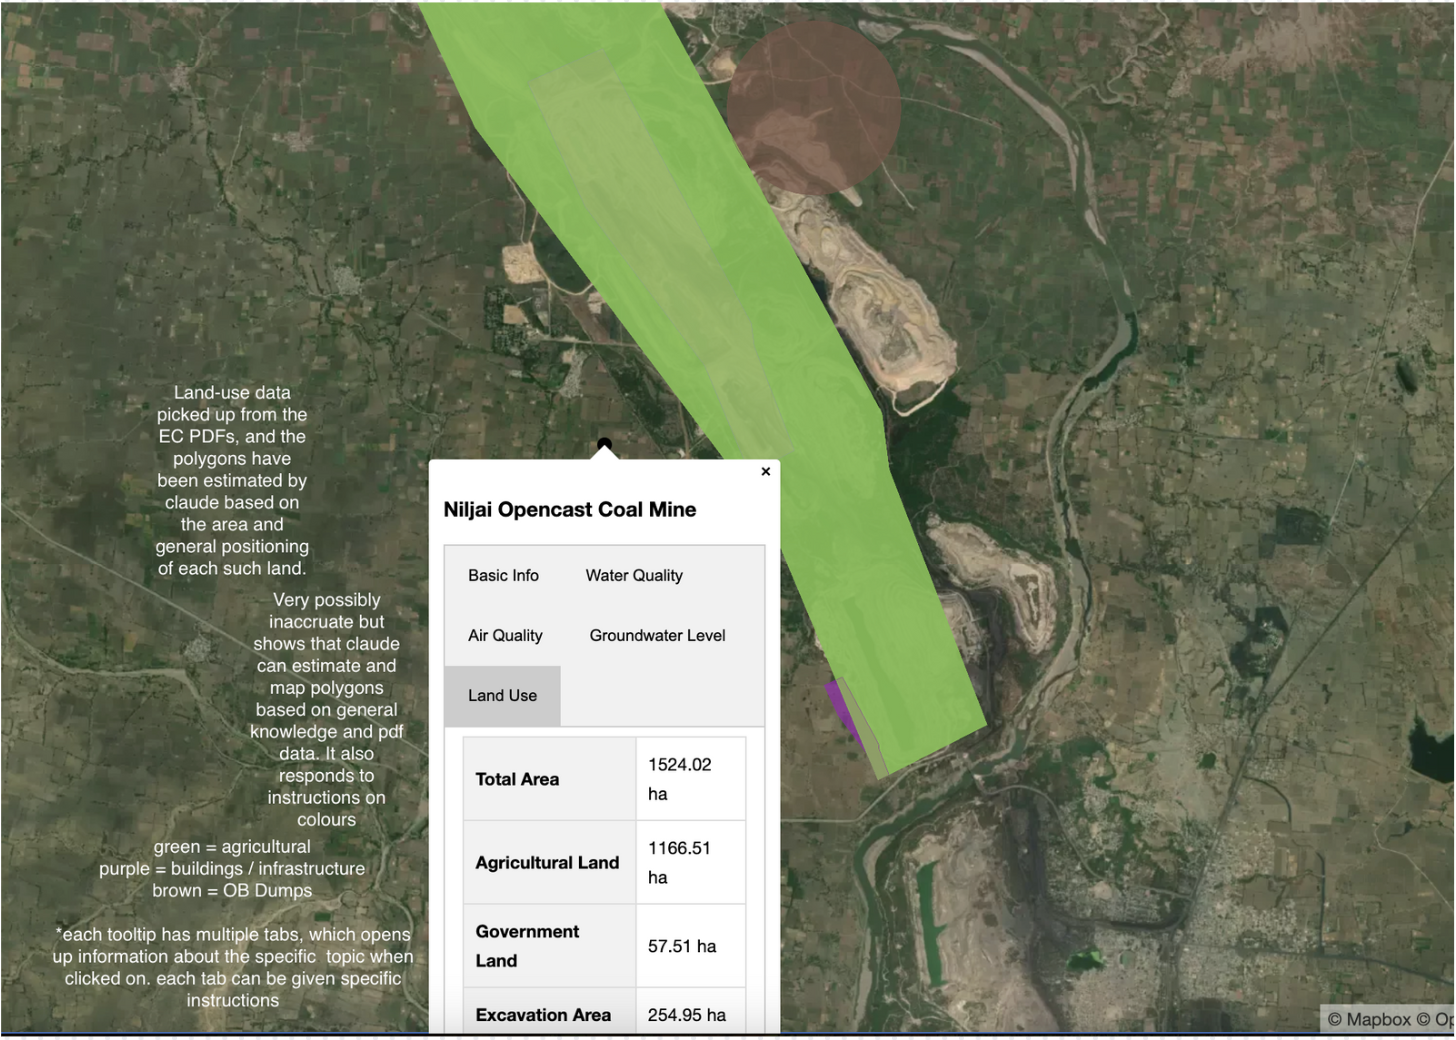
We further prompted Claude to 1. Create a tooltip for the basic information, water quality information, air quality information, groundwater levels, and land use around the mine; 2. Create a range for groundwater levels based on values across the uploaded PDFs and create a polygon on the map coloured with its respective value (from light blue to dark blue). While the polygons may not be fully accurate, Claude was able to estimate the values and land use types to an ~80% confidence level with minimal prompting (4-5 prompts).
WQ-INFO Prototype
- 1. Processed documents are uploaded and stored onto IBM Cloud. There are multiple documents per mine (entity) which can be identified through a unique identification (UID) (per entity) as predetermined by MoEFCC on their website
- 2. An API is generated by IBM to access these documents
- 3. The API can be called using any API-client. We used Bruno. The UID can be input into a new 'Parameter' field to extract the associated geojson output
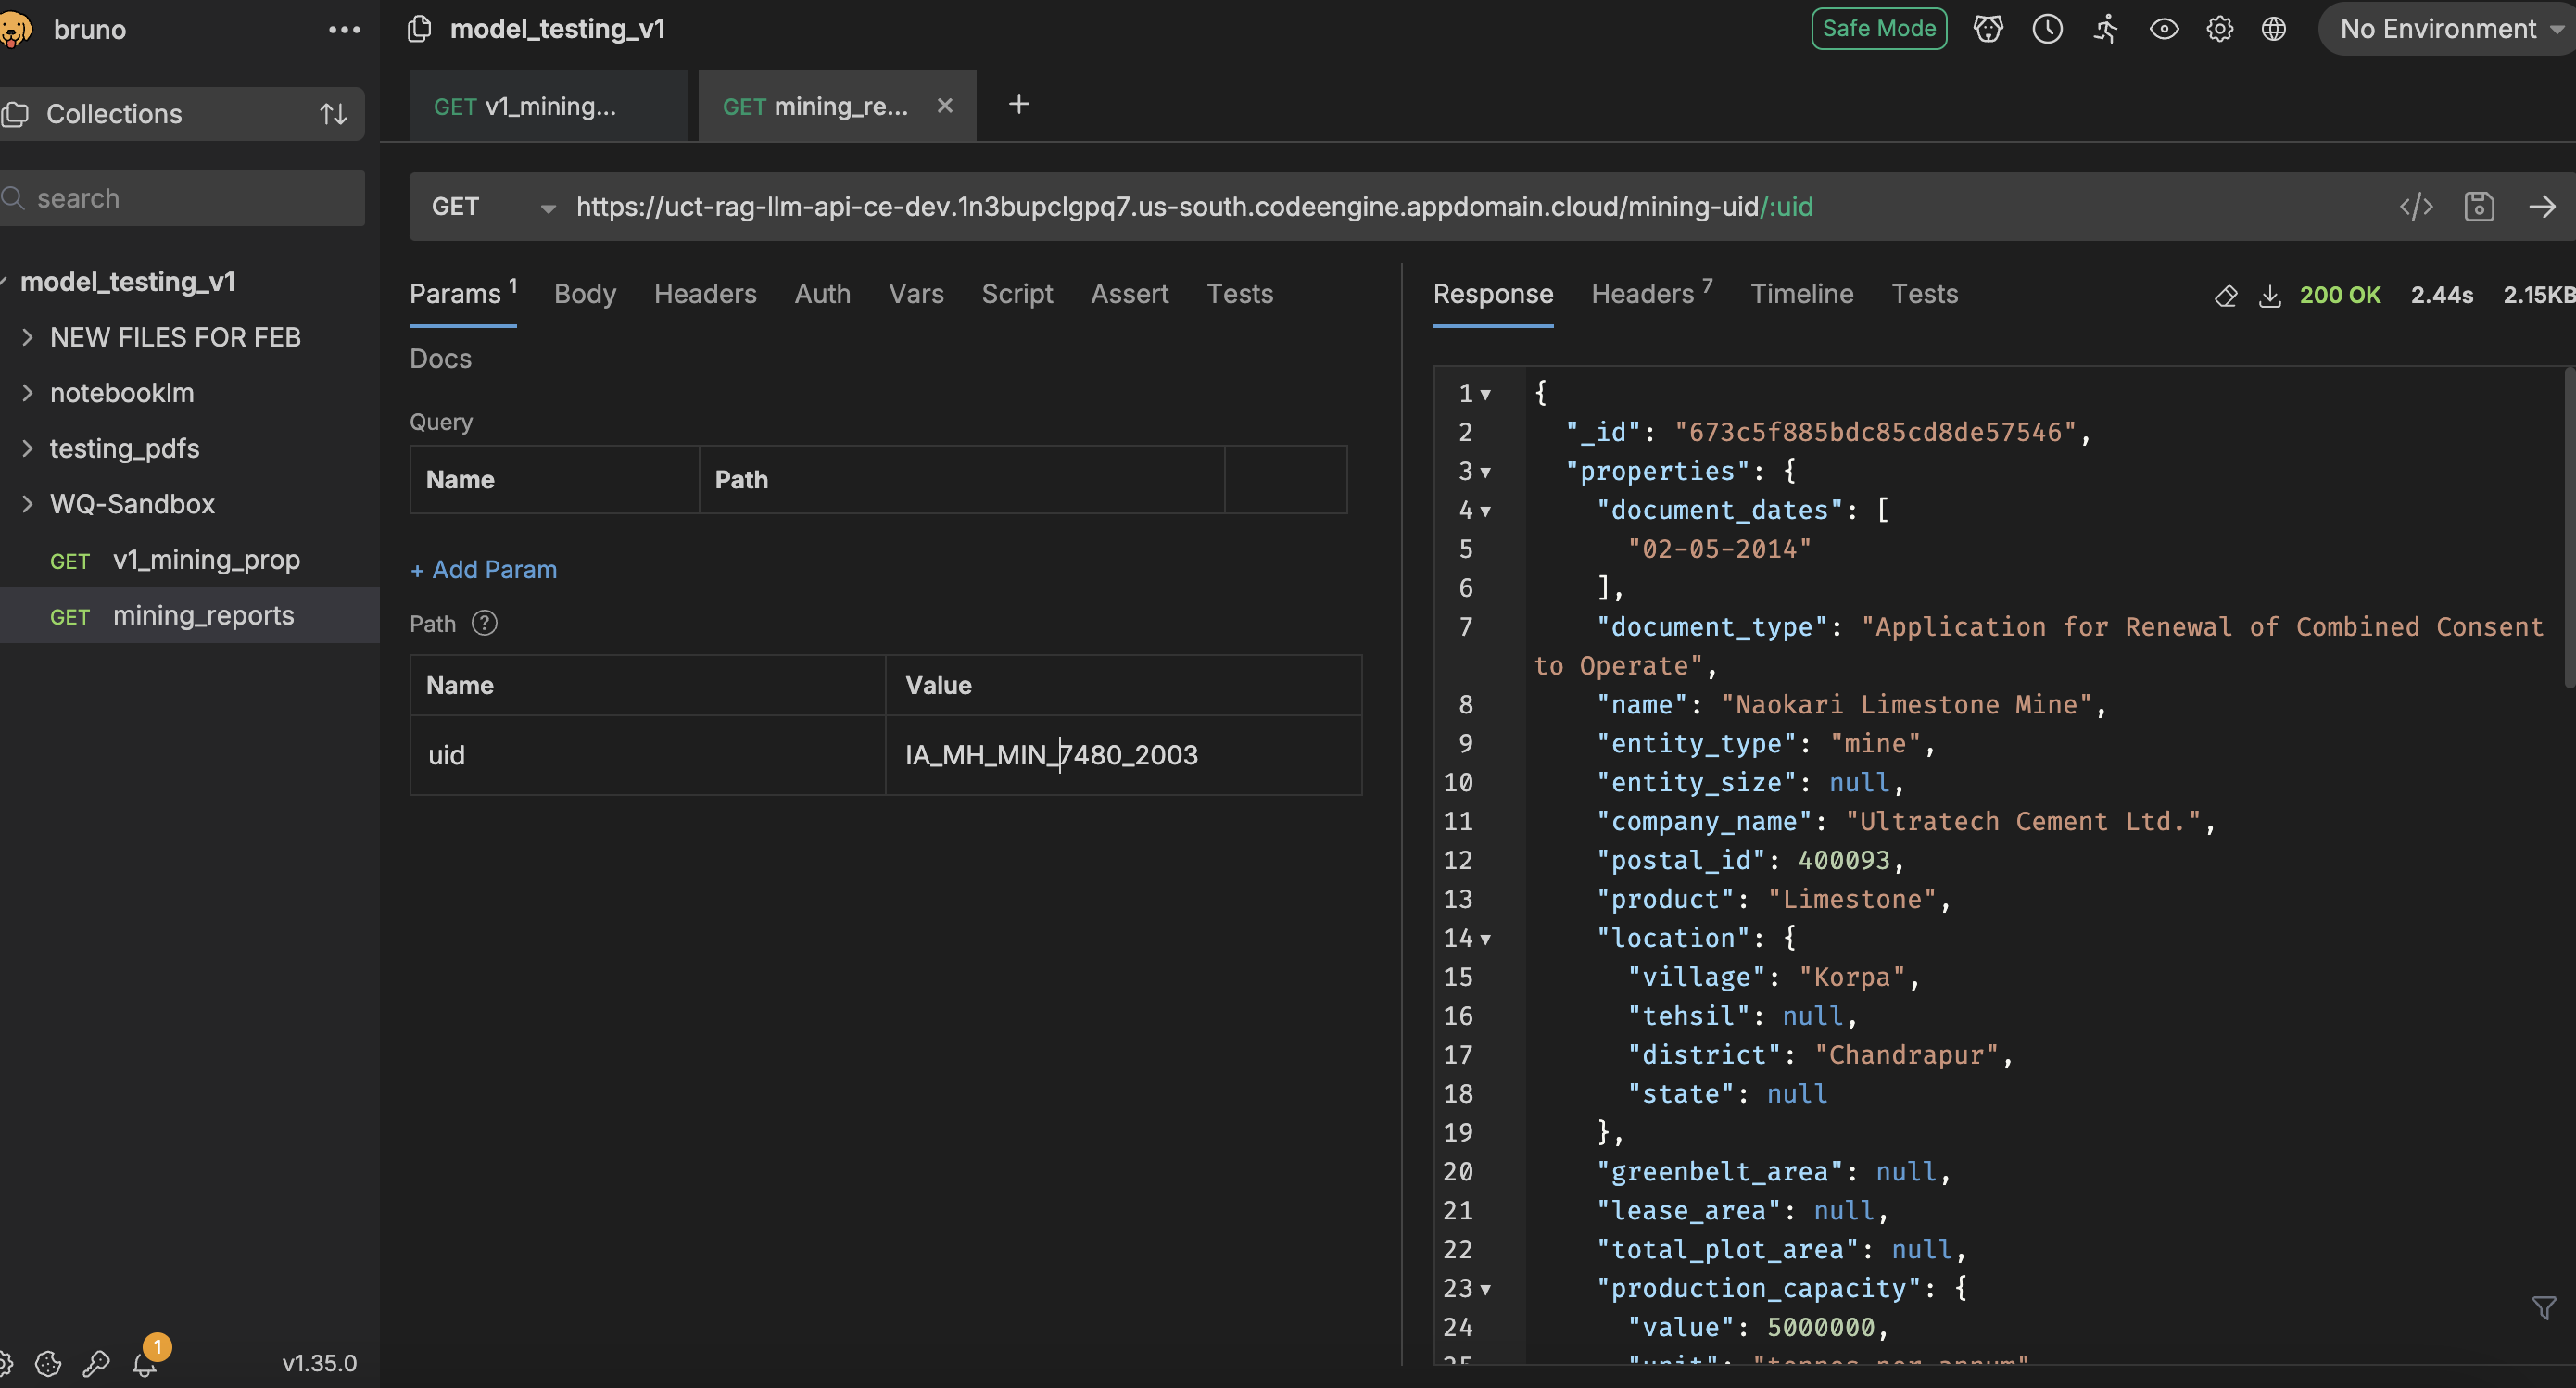
Model Testing
We tested WQ-INFO for a measure of accuracy by manually going through each PDF file and noting down our expected answers for each property listed, to identify for how many documents WQ-INFO was able to accurately extract data for each of the properties.
In the first round of testing, we found that the generalised models (ChatGPT 3o, Claude 3.5, and NotebookLM (built with Gemini 2.0))are able to extract at least as much data as WQ-INFO. The biggest difference was in the generalised models' ability to extract latitude-longitude coordinates compared to WQ-INFO.